Places Methodology
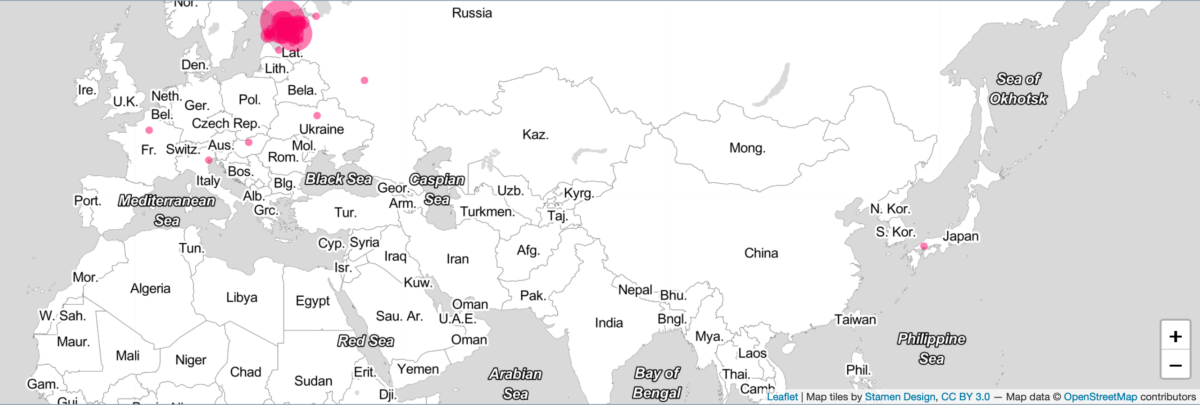
Map visualization with the search word “näitus” (“exhibition”)
Which cities were most frequently mentioned in Estonian newsreels? Did the emphasis of places mentioned change over years? How many times my home city was mentioned in the newsreels and when? Which places were not mentioned in the newsreels that are constantly discussed in the news today?
To these and many other questions you can find an answer by exploring the map visualisation above. For making this map, we have chosen to visualise those places that can be described with one dot in a map, such as cities, villages, boroughs, parishes, city districts, islands, and so on. We have left out from this visualisation larger areas, such as countries, regions, rivers, lakes, and mountains. (These are also listed in the underlying data, which you can check by a text query if you are interested.) The bigger the dot in the map is, the more times the place has been mentioned in the metadata. Although the map is quite exhaustive, it does not show all the places where newsreels were shot, or places that were mentioned by the voice over narrator, because the places visible in the map are extracted from the textual descriptions of the newsreels. If the annotators of the newsreels have not recognized a place where a news story was shot, you cannot see that in the map. Furthermore, each place has been calculated once for each news story, which means that even if a place has been mentioned several times in the description of a news story, it is calculated only once. In this way we show the distribution of places per news story, and not how many times the place has been mentioned in the metadata.
A lot depends on what the annotators of the newsreels have considered to be important. For example, scholars Indrek Ibrus and Maarja Ojamaa have pointed out that along mentioning the city of Tallinn, also many individual locations within the city were mentioned. Simultaneously, there are less mentionings of specific places within other cities.
Someone interested in the ways different exhibitions (näitus) were depicted in the Estonian newsreels finds out that although most of the newsreels containing footage related to exhibitions were located in Estonia, they covered also footage on European and even Asian cities. A way to dig deeper into this topic would be to study whether the geographic orietation of the footage related to exhibitions changes over time.
For making this map we ran Named Entity Recognition (NER) for the textual descriptions of Estonian newsreels. As a result, we received a list of place names, which we manually checked and corrected. After this we added longitudes and latitudes of the place names computationally, and checked and corrected the errors again by hand. As a result, we were able to calculate how many times each place was mentioned and locate them in the map. We use the OpenStreetMap as a basis, which corresponds with the contemporary borders and city names, but not necessarily with the historical ones. For further details on the algorithms used, please see Github